Submitted by jorgecardenas1 on Tue, 02/23/2016 - 22:17 Pro Licensee
In one virtual server that is on top of EXSi virtualmin show CPU chart 55% in system information but CPU loads are below 2%. See attached picture. Is it correct?
Status:
Active
Comments
Submitted by JamieCameron on Tue, 02/23/2016 - 22:40 Comment #1
How many CPU cores does this system have? The load is in cores, but the CPU usage is the fraction of the total cores installed.
Submitted by jorgecardenas1 on Wed, 02/24/2016 - 19:03 Pro Licensee Comment #2
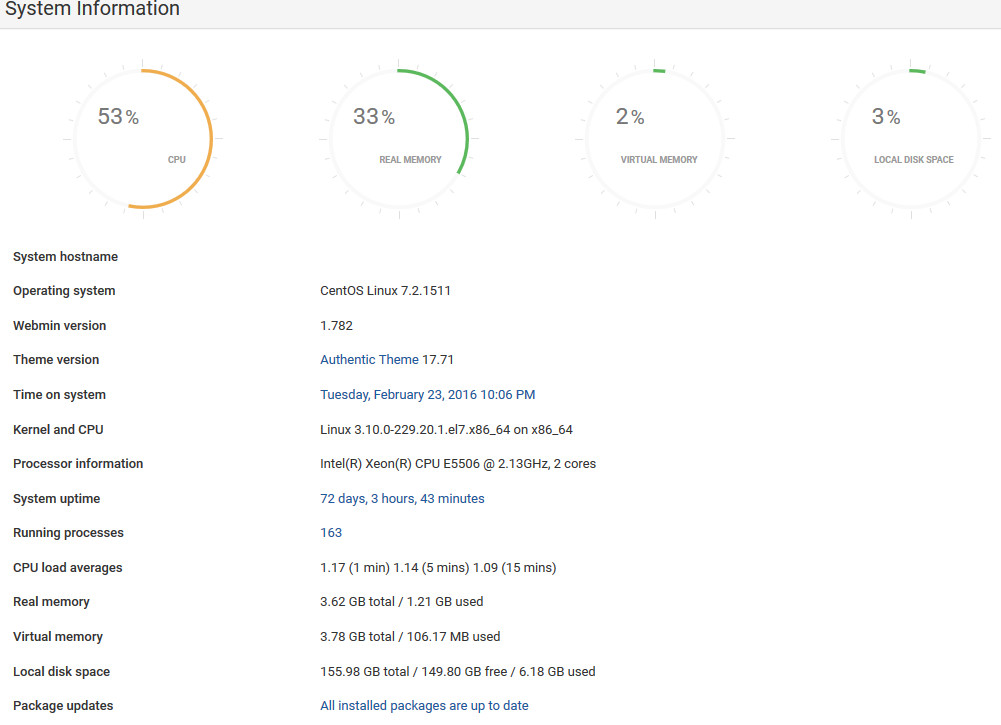
Server has an Intel(R) Xeon(R) CPU E5506 @ 2.13GHz, 2 cores. Server is virtualized with ESXi.
Cpu usage is less than 2% and load is 55%. The relation usage vs load does not seem correct.
Here are some statistics as of today:
There are six domains in this virtualmin server, four almost without activity, below are the stats for the ones with activity, one server has about 30 email active email account and second server has 3 email accounts:
Main site: a plan html site Month unique visitors Visitors Pages Requests Traffic Jan 2016 426 1,150 26,796 29,907 70.25 MB Feb 2016 426 820 33,392 36,704 154.69 MB
Second site: Drupal 8 site Month unique visitors Visitors Pages Requests Traffic Jan 2016 226 350 25,954 29,169 177.01 MB Feb 2016 187 270 18,100 20,553 116.28 MB
Submitted by JamieCameron on Wed, 02/24/2016 - 23:14 Comment #3
Is the system perhaps low on RAM and swapping? That can drive up load even when CPU usage is low.
Submitted by jorgecardenas1 on Thu, 02/25/2016 - 12:13 Pro Licensee Comment #4
Server has 32Gb RAM and assigned to Virtualmin are 4 Gb. Ram usage is usually 33% or 1.3Gb reported by virtualmin. The Ram chart matches with the Ram used reported in Virtualmin.
You may see the jpg attachment from first post for all those details.
However on Vmware I can see CPU total is about 55% and memory has been used all 4Gb, I will double the memory on the weekend but even when this means CPU chart is accurate at 55%, the cpu usage seems it is not at 2%.
Submitted by jorgecardenas1 on Thu, 02/25/2016 - 13:21 Pro Licensee Comment #5
I just got:
100% CPU 35% Real Memory 3% Virtual memory 3% Local disk space
Running processes 186 CPU load averages 1.15 (1 min) 1.22 (5 mins) 1.17 (15 mins) Real memory 3.62 GB total / 1.28 GB used Virtual memory 3.78 GB total / 116.69 MB used Local disk space 155.98 GB total / 149.78 GB free / 6.20 GB used
The chart seems more accurate 100% versus 94.54% cpu showed in vshpere cpu performance stats. But 94.54 was the top just a few seconds and then got back to normal. Virtualmin after several minutes still has 99% CPU and vshpere was down to 50.41% after a few seconds from 94.54%, Average shows vsphere 53.231%.
So it still does not make sense the 100% cpu chart versus 1.17 cpu load averages on virtualmin.
Now after comparing with vsphere the chart which is the closes to vsphere does not update as often as it should. It is confusing and I want to understand the chart and the load betters so I can trust in their numbers to better plan resources like memory or CPU.
Submitted by JamieCameron on Thu, 02/25/2016 - 21:39 Comment #6
Note that the System Information page in Virtualmin isn't refreshed real-time by default - the info is collected in the background and updated only once per minute. Also, load is averaged over at least 1 minute, and does really measure the same thing as CPU usage.
Submitted by jorgecardenas1 on Sat, 02/27/2016 - 08:42 Pro Licensee Comment #7
Today's values are 100% CPU 39% Real memory 3% Virtual Memory 4% Local Disk Space and 1.01 cpu load average Next minute 57% CPU but load average remains 1.04 (1min) 1.10 (5 min) 1.12 (15min)
Load average is always below 2 and cpu always above 50% is it correct? I would expect load average about 50 for a 50% CPU or 1% CPU as load average values.
Submitted by JamieCameron on Sat, 02/27/2016 - 16:57 Comment #8
The best way to test this is to start off a couple of processes that use 100% CPU, and see if the load hits 2.0 and CPU hits 200%.
Note that Virtualmin just gets these numbers from the
uptimeandtopcommands - so if they are inaccurate, there isn't much we can do.